🪵 grafana lbac with teams
label-based access control using grafana teams
tl;dr
Not everyone needs access to production logs. We set up some quick regex rules to filter log / metric / trace access by team.
uh oh... provisioned datasources
If you're on Grafana's Cloud offering, your Loki / Prometheus / Tempo datasources are automatically provisioned and label-based access controls (LBAC) are not available.
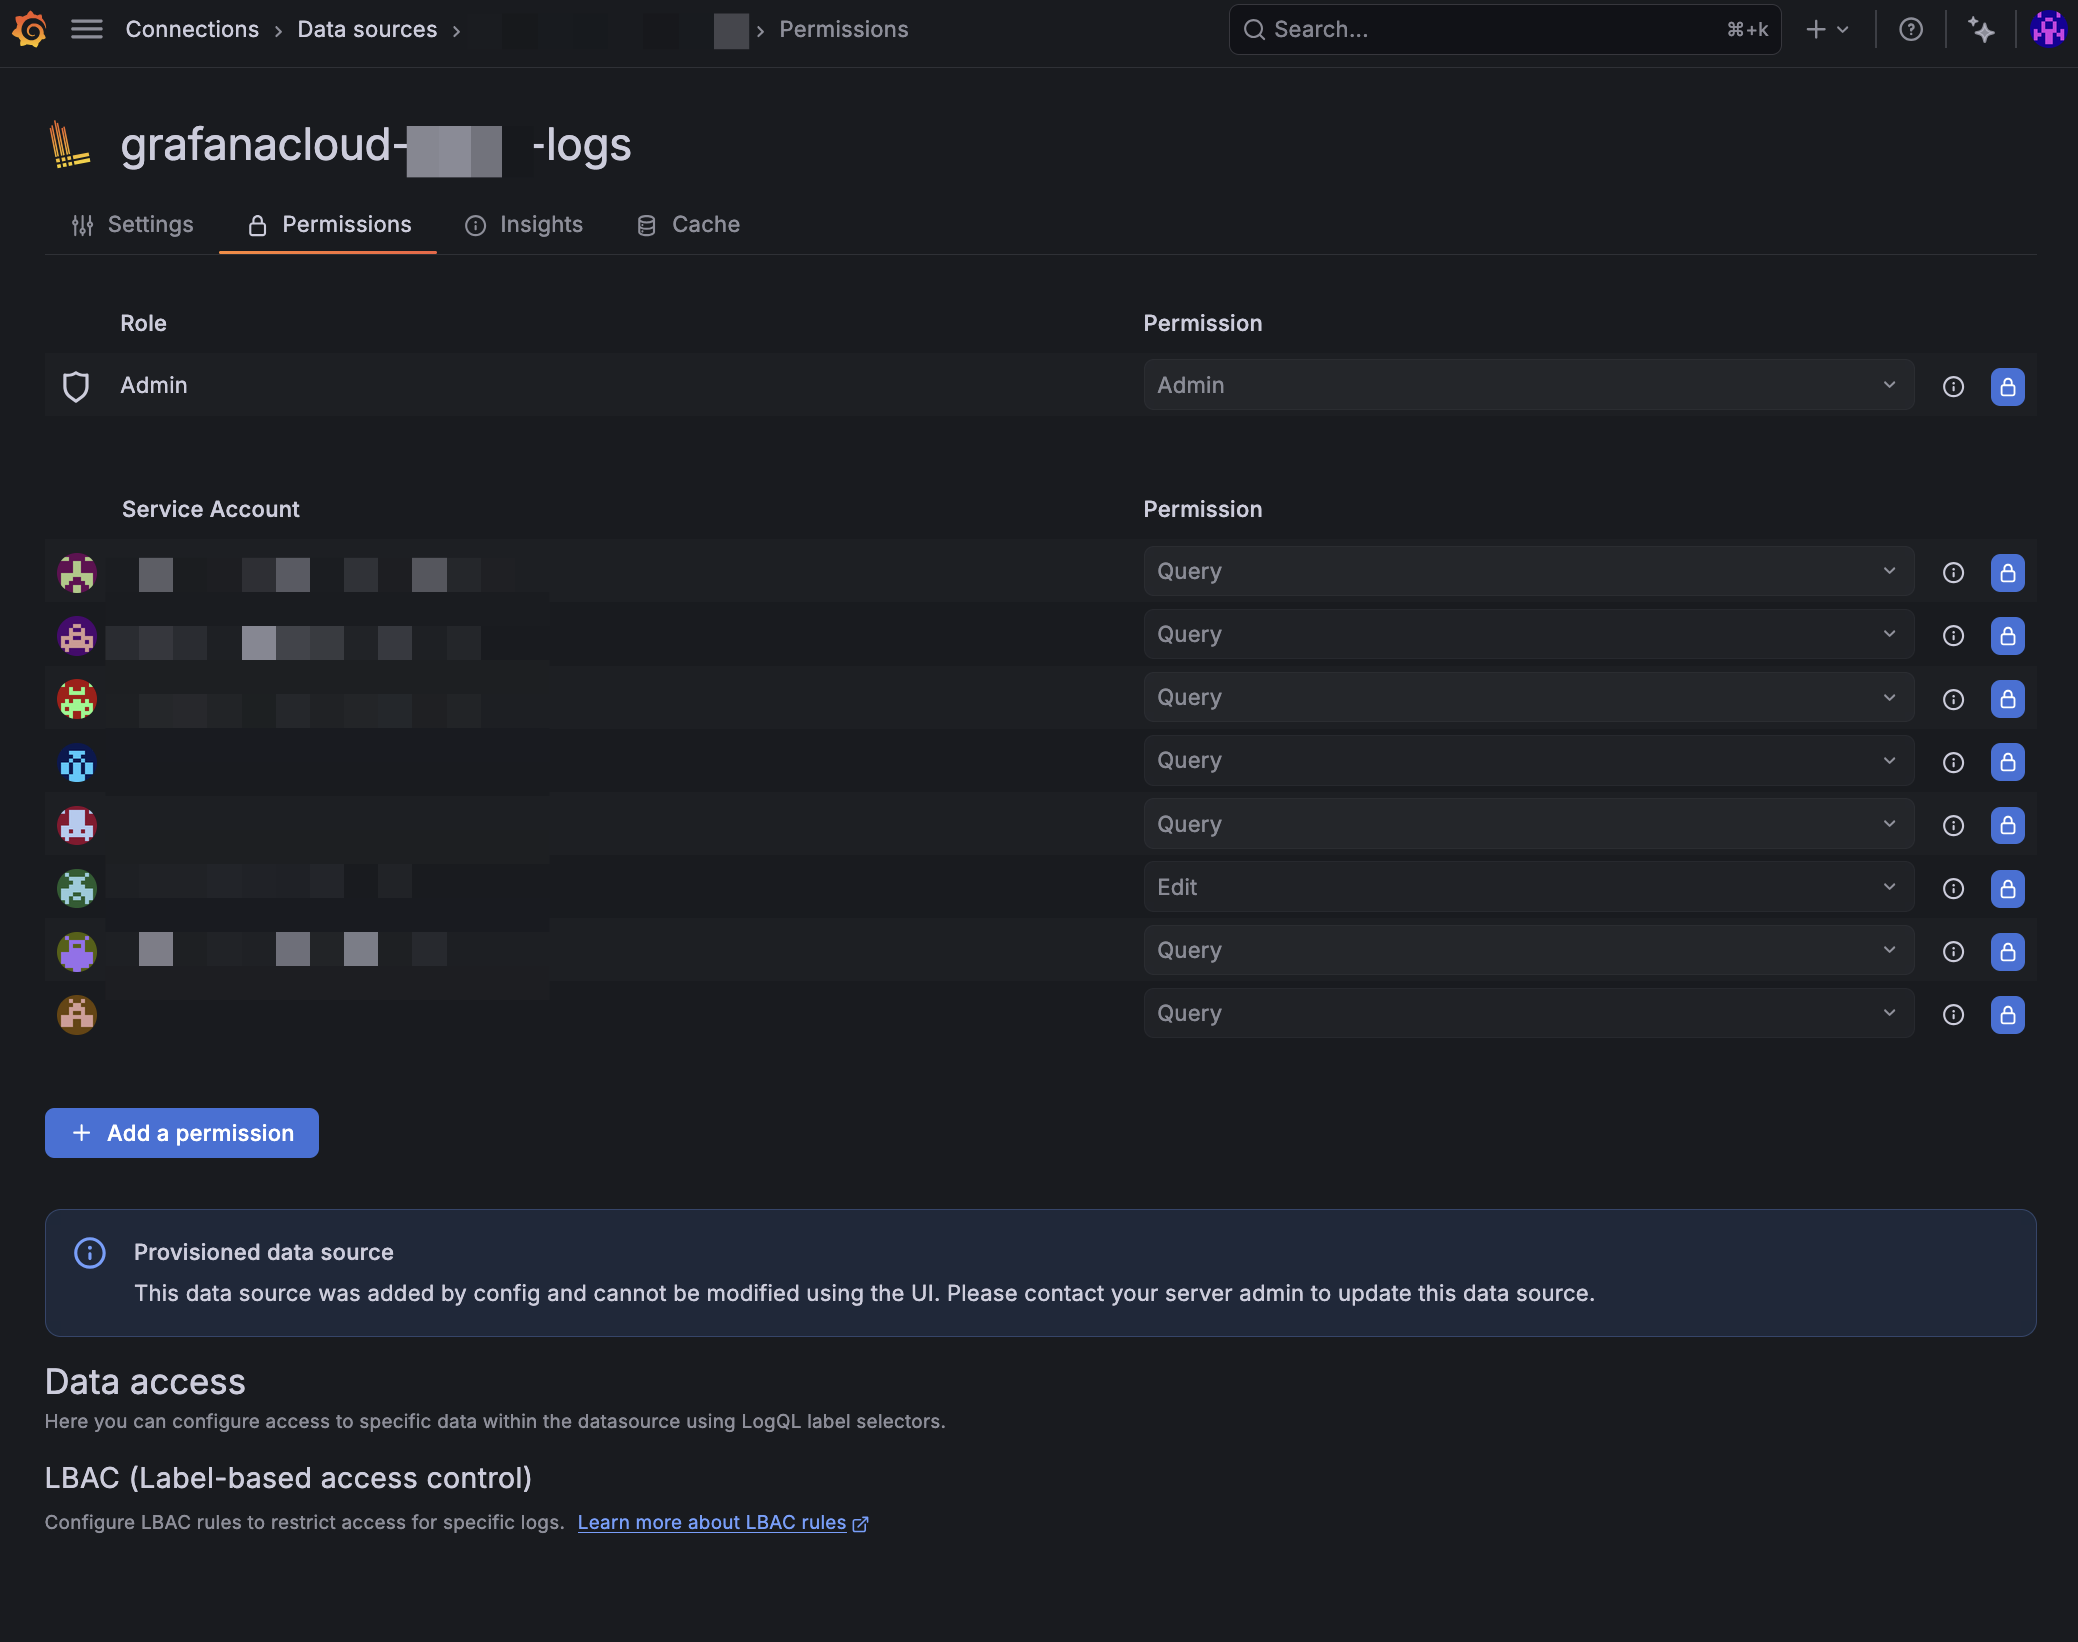
This is a roadmap item that is currently in development. You can track the progress here.
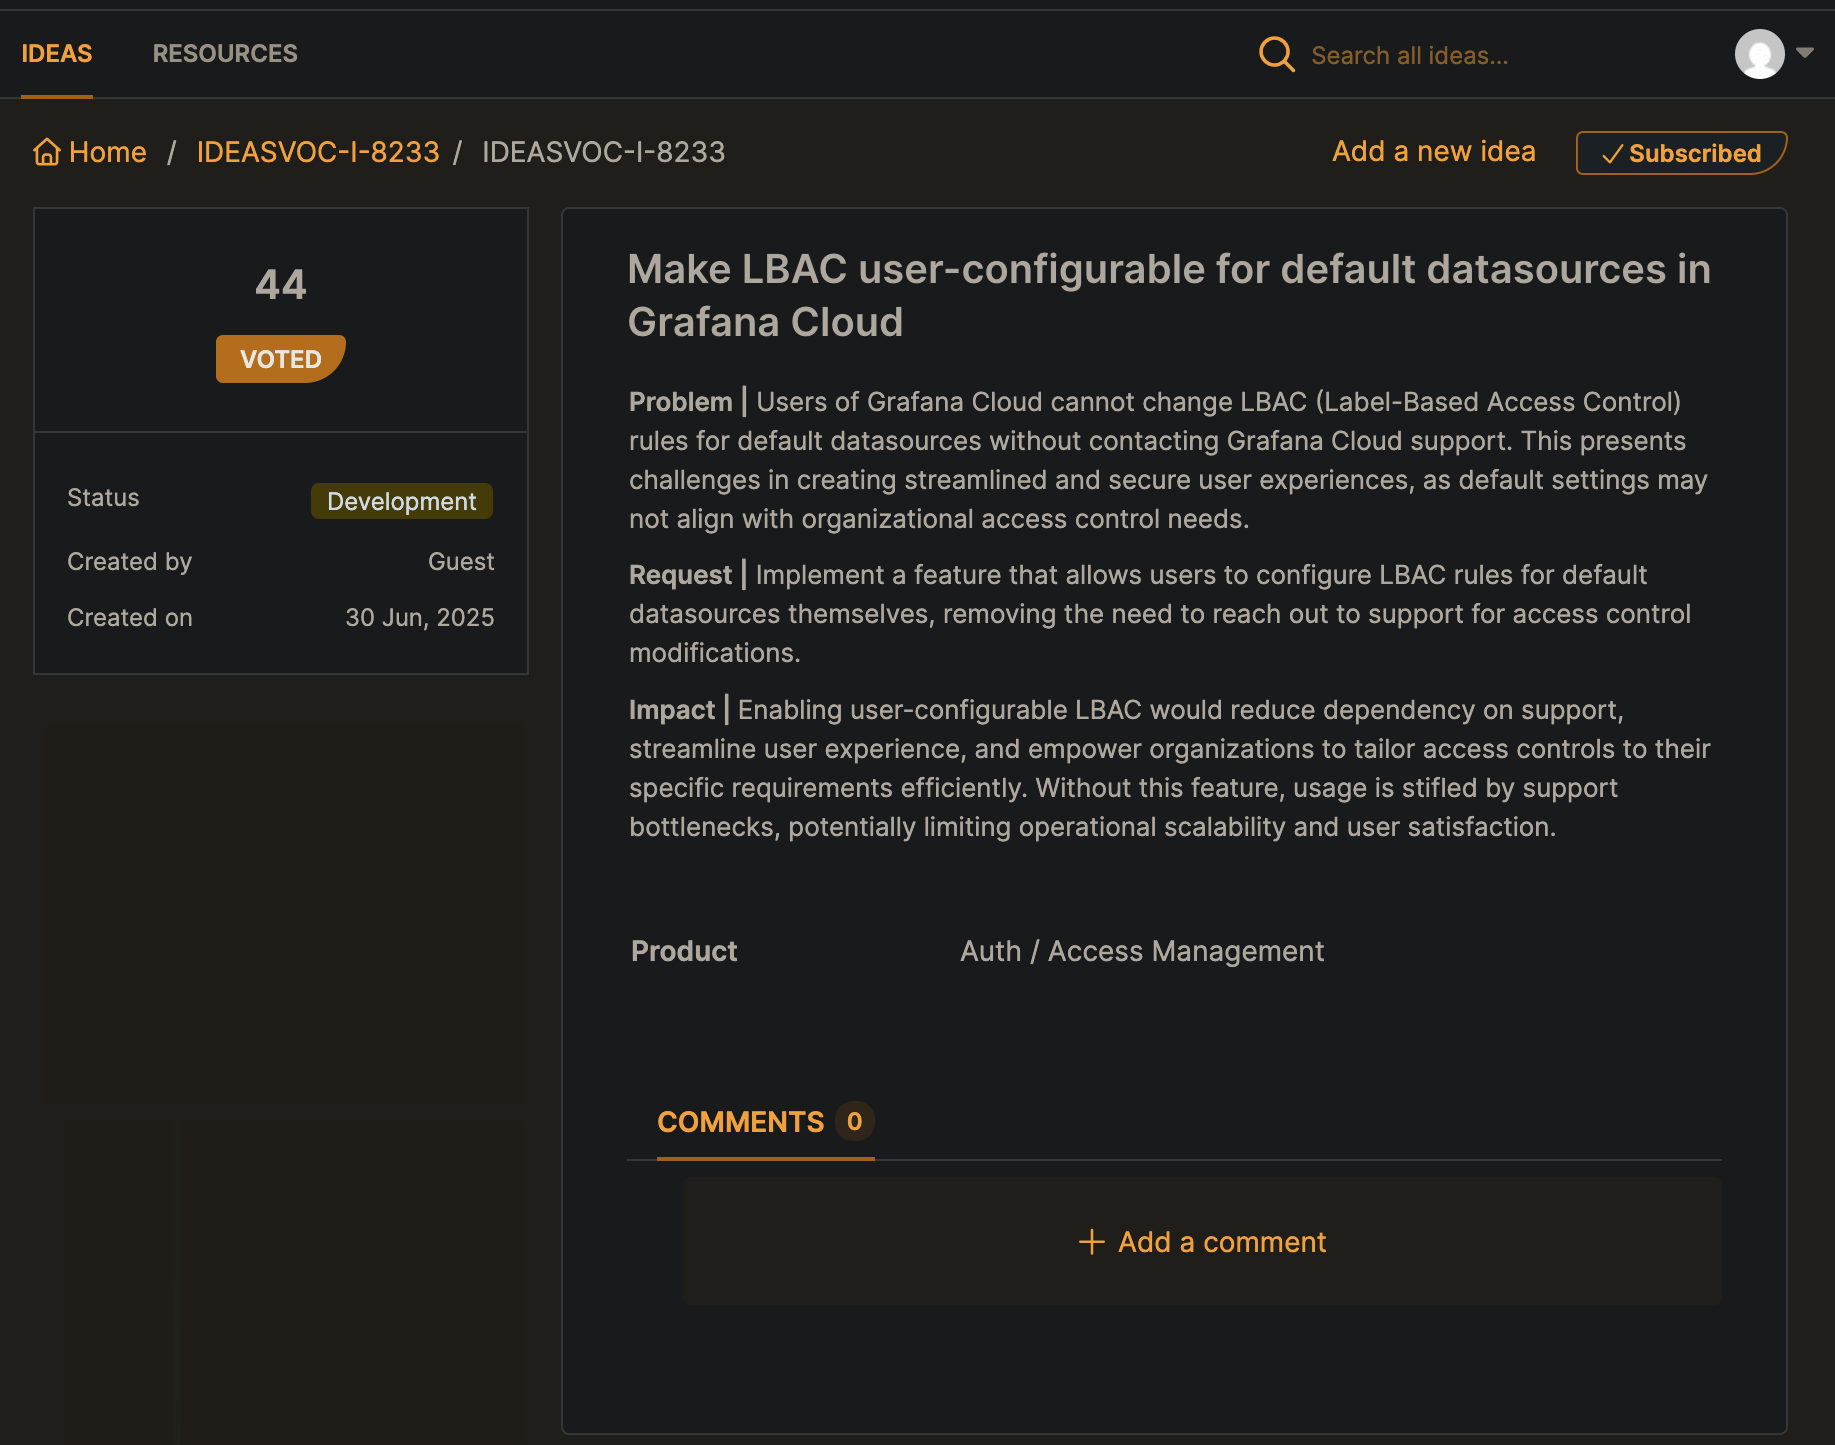
The canonical way to get around this is to create new datasources via fresh Cloud Access Policies (CAPs). Once you've done this, ensure that you've locked down the provisioned datasources so that only Admin has permissions. Don't forget to update any dashboards that use the provisioned datasources.
back to lbac
(that might be a devops winehouse pun)
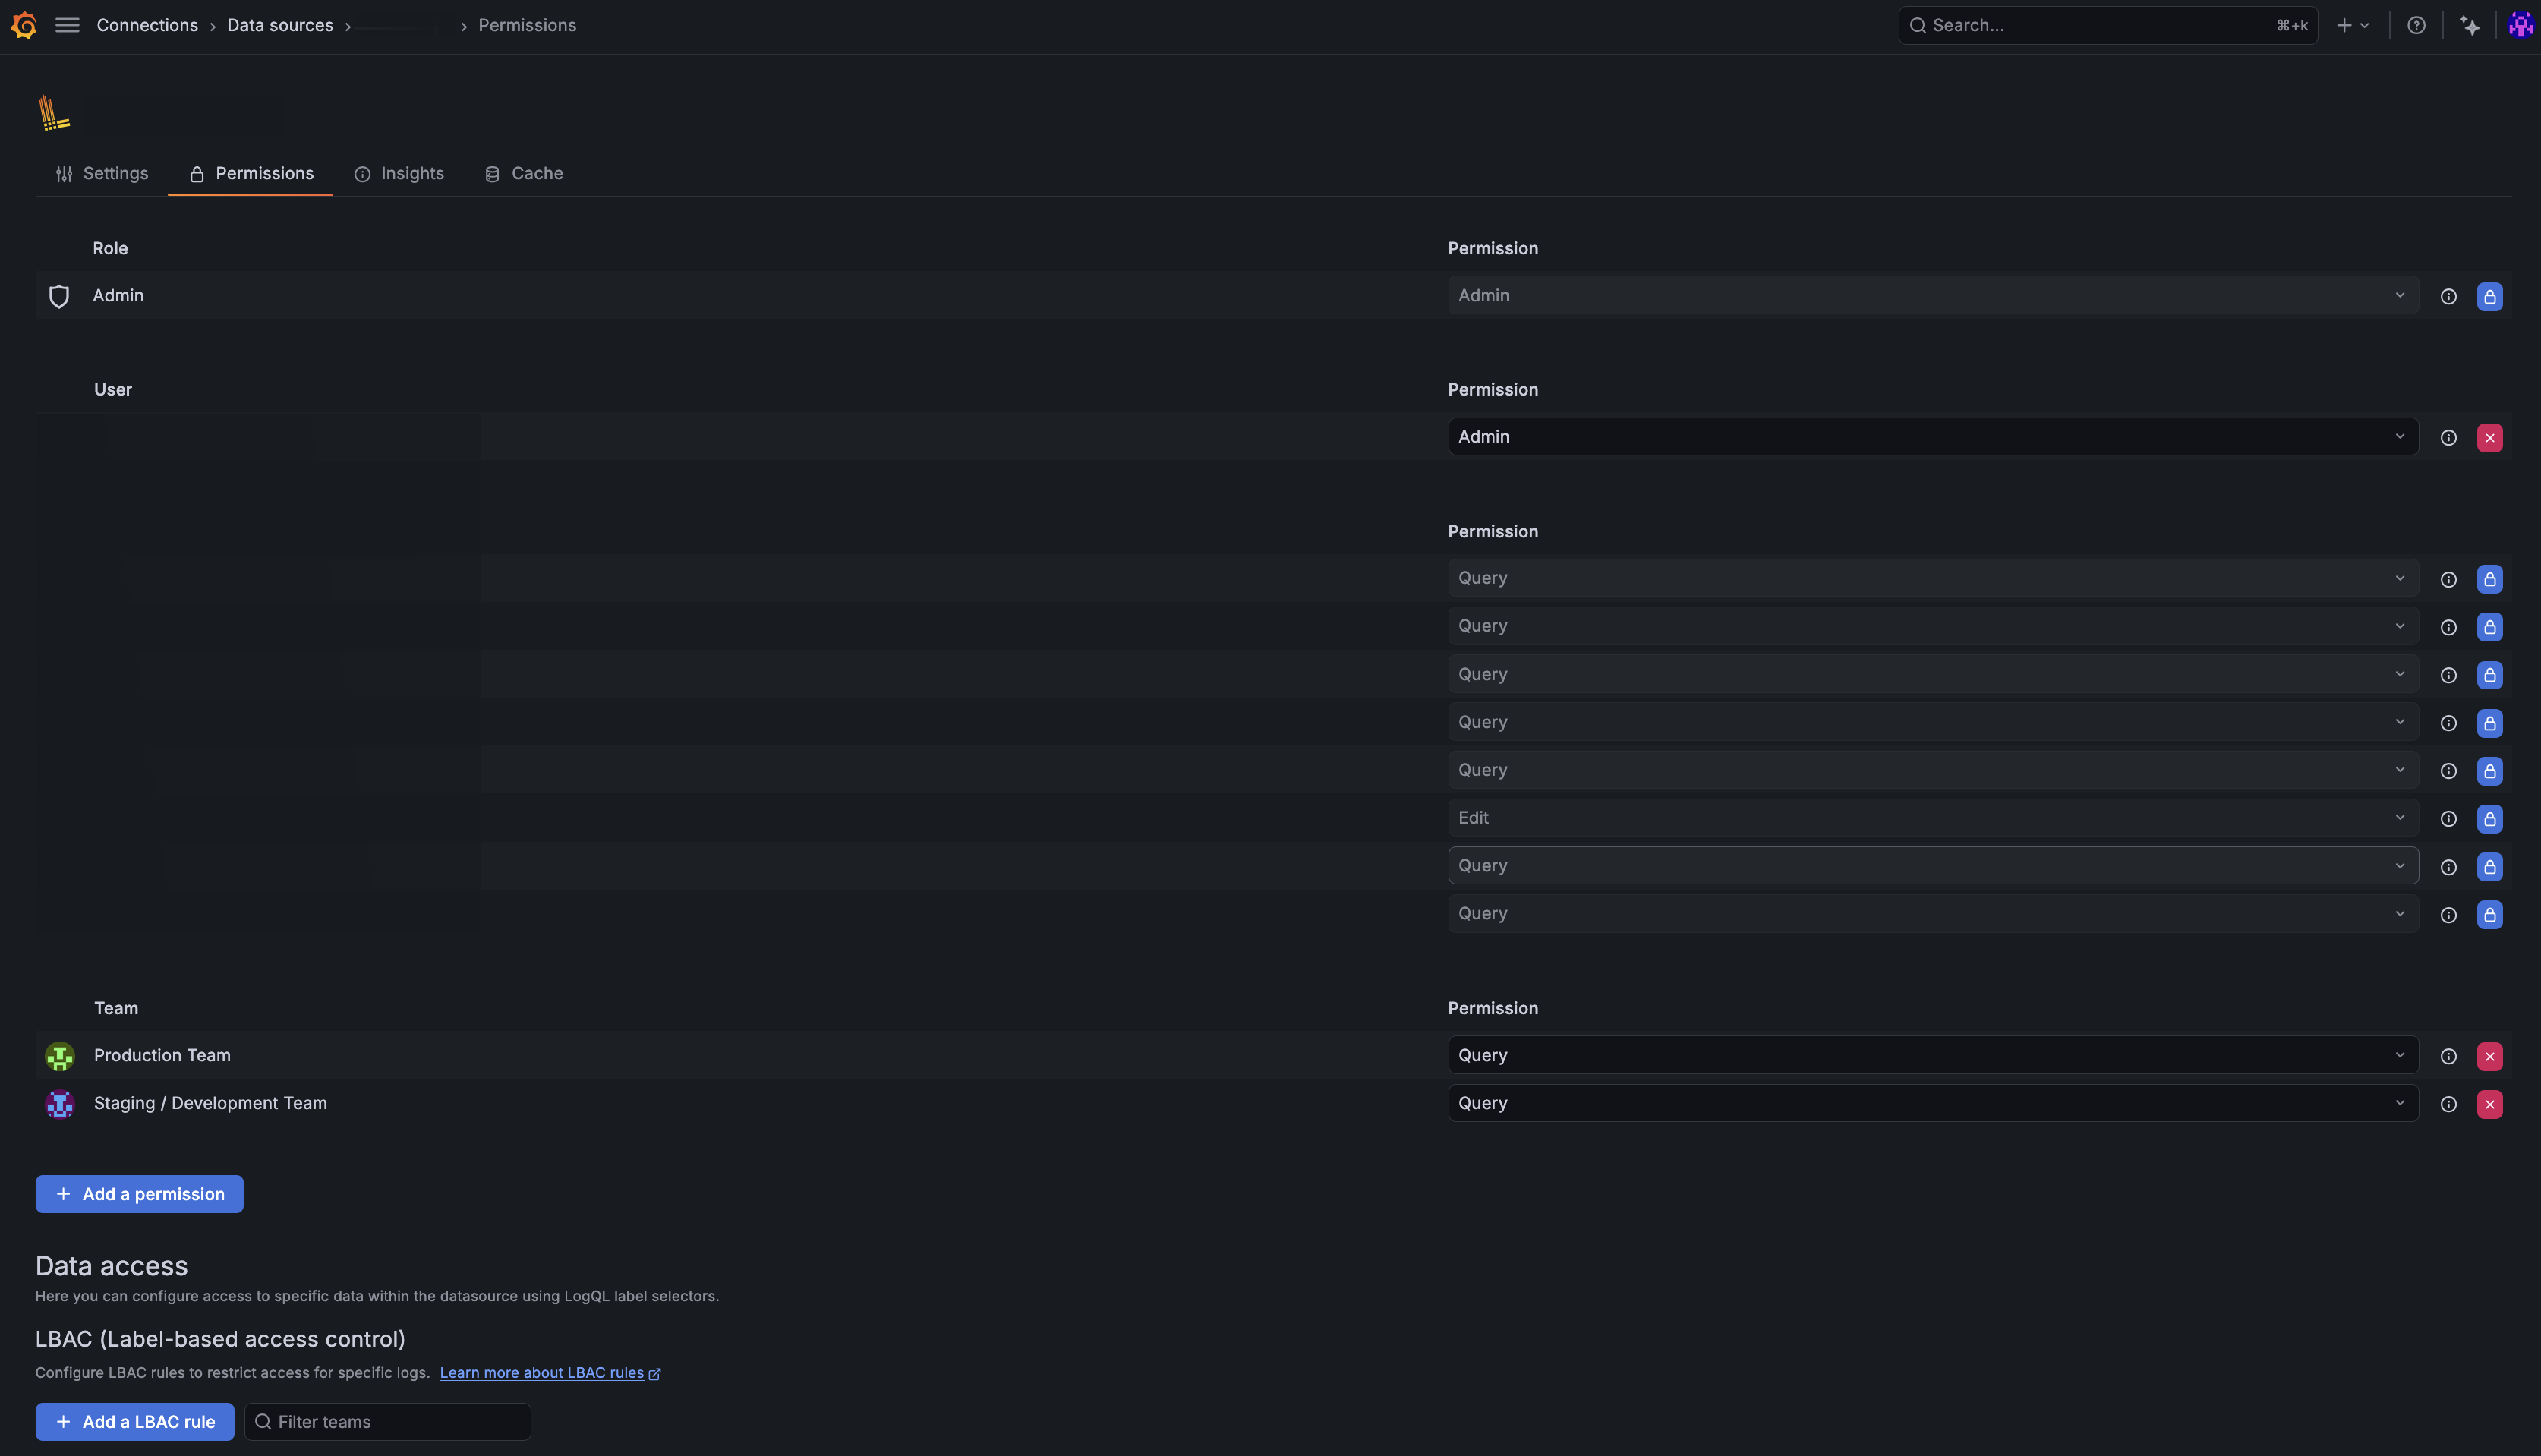
Now that's out of the way, make two teams and Add them with Query permissions to the new datasource.
regex rules
Now that you've got two teams with Query permissions to the new datasource, you can set up some regex rules to filter log / metric / trace access by team.
You'll want to hook on a reliable label that is present in all your logs, metrics, and traces. For example, the service_name label is a good candidate. I recommend setting this via IaC e.g. Ansible to ensure consistency.
Production: { service_name=~".*" }
Staging / Development: { service_name=~".*(stg|dev|staging|development).*" }
It's really that easy! No need for complex per-dashboard IAM / RBAC, LBAC ensures that the right team has access to the right logs, metrics, and traces at the datasource level.